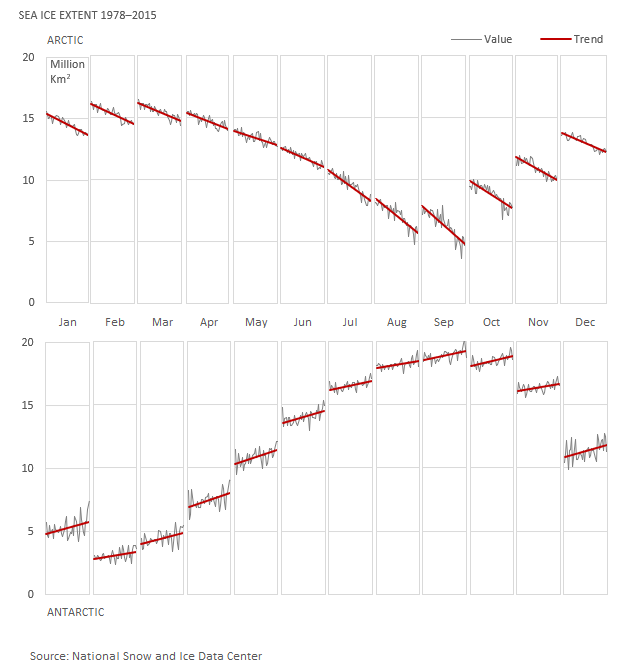
Artic Sea Ice Extent
In this article we produce a chart of monthly artic sea ice extent

The chart above is from the book Data At Work by Jorge Camoes. In this article we try to recreate the chart from Chapter 13 - Profiling, that displays the extent of Artic and Antartic sea ice from 1978-2015. We will use the Altair charting library.
import pandas as pd
import numpy as np
from pathlib import Path
import ipywidgets as widgets
import calendar
import altair as alt
root=Path('../data/seaice')

month_files = [str(f) for f in root.glob('*.csv')]
def load_month(index):
    month_file = month_files[index]
    df = pd.read_csv(month_file, dtype={'year': str})
    df.columns = [col.strip() for col in df.columns]
    df = df.replace(-9999.0, np.nan).replace('-9999', np.nan)
    df = df.fillna(method='ffill')
    return df

monthly_ice = {i : load_month(i) for i in range(len(month_files))}
height=140
width=100

def ice_chart(month, col='extent'):
    return alt.Chart(monthly_ice[month]).mark_line().encode(
        x=alt.X('year:T',
                axis=alt.Axis(title='')),
        y=alt.Y(f'{col}:Q',
                scale=alt.Scale(domain=(3, 18)),
                axis=alt.Axis(title=''))
    ).properties( height=height,
                  width=width,
                  title=f'{calendar.month_name[month +1]}'
        )

def ice_charts(col='extent'):
    first_half = ice_chart(0, col) | ice_chart(1, col) | ice_chart(2, col) \
                | ice_chart(3, col) | ice_chart(4, col) | ice_chart(5, col)
    second_half = ice_chart(6, col) | ice_chart(7, col) | ice_chart(8, col) \
                | ice_chart(9, col) | ice_chart(10, col) | ice_chart(11, col)

    return alt.vconcat(first_half,
                second_half
               ).properties(
                 title=f'Monthly Sea Ice {col.title()} 1978-2020 million km\u00B2'
            )
ice_charts()
ice_charts('area')